We can't find the internet
Attempting to reconnect
Something went wrong!
Hang in there while we get back on track
Wed, November 27, 2024
Agent-less system monitoring with Elixir Broadway

We've started working on something that will be a critical component the Opsmaru platform. This part requires having proper infrastructure monitoring for several reasons. While Opsmaru has health monitoring for every cluster managed by the platform, it doesn't give us deep insights into the metrics of the systems.
Up until this point we've delayed the development of any system monitoring because there wasn't a real elegant way for us to do system monitoring (primarily Memory, Disk, CPU, Load). What we mean by that is most of the existing solutions out there require some kind of agent to be installed. Whether you are using fluentd, syslog-ng, logstash, vector, you would have to install them on the running machine. More software means more maintenance cost of keeping them up-to-date, wrangling configuration to get what you need out of them.
Understanding the Architecture
Before going deep into the code that would enable us to do system monitoring we first need to look at the architecture and how Opsmaru actually operates.
When you setup a cluster on Opsmaru, it automatically provisions the Uplink module. The Uplink module is what performs all the orchestration / setting up and manages all the app containers running inside the cluster. It does all of this through the LXD hypervisor's api.
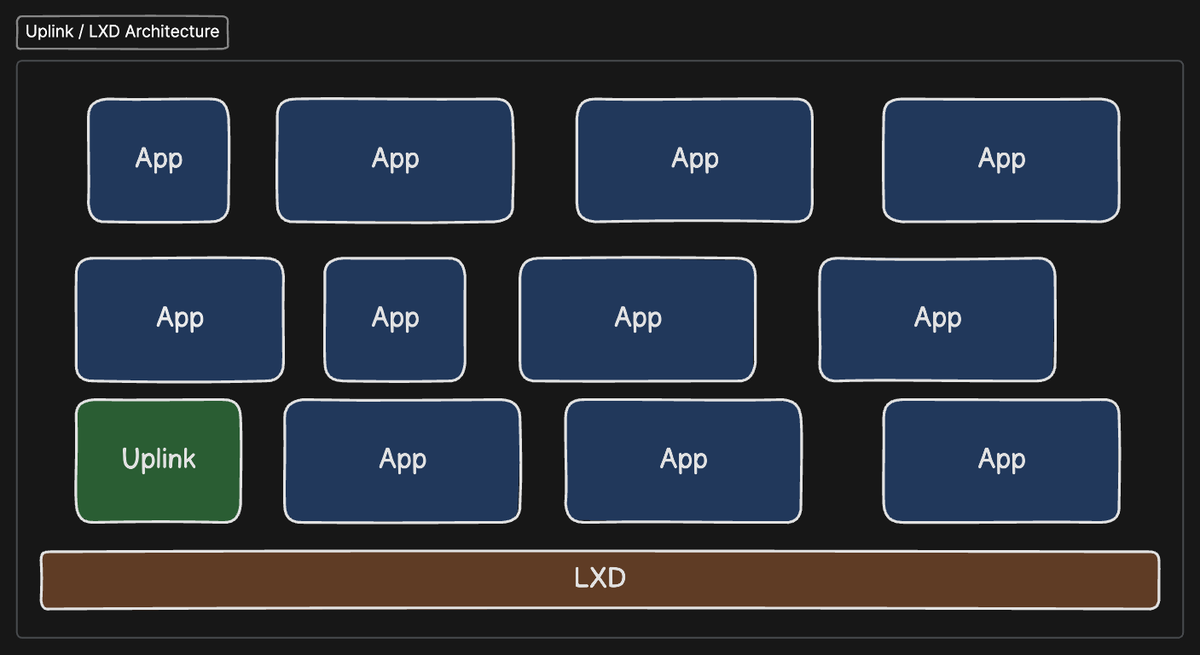
Uplink is a module that we developed and open-sourced. Given that we already have something running that manages the cluster for us. It makes sense that we should be able to extend the functionality of uplink to handle system monitoring as well. This was the basis behind the implementation. On top of this we already knew about Elixir's Broadway library so implementing something within uplink to do this was obvious.
Retrieving the Data
LXD already has certain metrics exposed through the /1.0/metrics API. If we call this we would be able to retrieve the metrics of the containers running. There was also another endpoint which would give us some of the metrics /1.0/instances. This meant we had everything we need to be able to collect the metrics data. Great!
We already have an LXD client for elixir so we can coveniently call these endpoints through our wrapper. Calling the function gives us a list of instances with a snapshot of data like cpu, disk, memory and networking usage. This is only a snapshot of the data when we call the function. We will need to do some data processing to get the CPU load from the usage time.
alias Uplink.Clients.LXD
> LXD.list_instances(recursion: 2)

[
  %Uplink.Clients.LXD.Instance{
    # Redacted for brevity ...
    state: %{
      "cpu" => %{"usage" => 136630751000},
      "disk" => %{"root" => %{"total" => 0, "usage" => 40831488}},
      "memory" => %{
        "swap_usage" => 0,
        "swap_usage_peak" => 0,
        "total" => 0,
        "usage" => 1998848,
        "usage_peak" => 0
      },
      "network" => %{
        "eth0" => %{
          "addresses" => [
            %{
              "address" => "240.1.252.128",
              "family" => "inet",
              "netmask" => "8",
              "scope" => "global"
            },
            %{
              "address" => "fe80::216:3eff:fe28:5f9a",
              "family" => "inet6",
              "netmask" => "64",
              "scope" => "link"
            }
          ],
          "counters" => %{
            "bytes_received" => 215421737,
            "bytes_sent" => 3562213,
            "errors_received" => 0,
            "errors_sent" => 0,
            "packets_dropped_inbound" => 0,
            "packets_dropped_outbound" => 0,
            "packets_received" => 53456,
            "packets_sent" => 32510
          },
          "host_name" => "veth7cd391d8",
          "hwaddr" => "00:16:3e:28:5f:9a",
          "mtu" => 8951,
          "state" => "up",
          "type" => "broadcast"
        },
        # Redacted for brevity ...
    }
  }
]
To retrieve the metrics from /1.0/metrics we call the below.
> LXD.list_metrics(target: "cluster-member-name")

[
  %PrometheusParser.Line{
    line_type: "ENTRY",
    timestamp: nil,
    pairs: [
      {"cpu", "0"},
      {"mode", "system"},
      {"name", "insterra-0710c9ca-01"},
      {"project", "upmaru.insterra"},
      {"type", "container"}
    ],
    value: "23297.273635",
    documentation: nil,
    type: nil,
    label: "lxd_cpu_seconds_total"
  },
  %PrometheusParser.Line{
    line_type: "ENTRY",
    timestamp: nil,
    pairs: [
      {"cpu", "0"},
      {"mode", "user"},
      {"name", "insterra-0710c9ca-01"},
      {"project", "upmaru.insterra"},
      {"type", "container"}
    ],
    value: "36249.169252",
    documentation: nil,
    type: nil,
    label: "lxd_cpu_seconds_total"
  }
  # Redacted for brevity...
]
The output of the list_metrics will return prometheus formatted output. We used the :prometheus_parser to convert the data into something we can work with.
Timeseries Data Collection
Now that we have access to the data the next decision is to decide where to ship all that data. We decided to go with Elastic stack because on top of being a great choice for timeseries it can also be used for other things like AIOps / Search and many other things we have plans for.
Given that the data collected is a snapshot of the system at the time of collection we will probably need to collect multiple data points at a given time interval and do some processing before we ship the data to elastic.
Implementing the Broadway Producer
We want our producer to collect data at a given interval and send the data to our pipeline. Let's take a look at what that looks like.
defmodule Uplink.Metrics.Producer do
  use GenStage
  @behaviour Broadway.Producer

  @doc false
  def start_link(opts) do
    GenStage.start_link(__MODULE__, opts)
  end

  @impl true
  def init(opts) do
    poll_interval = Keyword.get(opts, :poll_interval, 15_000)
    next_schedule = div(poll_interval, 3)

    state = %{
      demand: 0,
      poll_interval: poll_interval,
      cycle: 0,
      previous_cpu_metrics: [],
      previous_network_metrics: [],
      cpu_60_metrics: [],
      cpu_300_metrics: [],
      cpu_900_metrics: []
    }

    Process.send_after(self(), :poll, next_schedule)

    {:producer, state}
  end

  # ...
end
The reason we need to store cpu_x_metrics, previous_cpu_metrics and previous_network_metrics is that we need to be able to get the change in these values. The cpu_x_metrics allow us to compute the load 1, load 5 and load 15 values, as you'll later see.
We pass in the :poll_interval as a configurable parameter. Next we need to implement the handle_demand callbacks of GenStage. We return an empty list when the demand is <= 0, otherwise we check whether we're ready_to_fetch?.
defmodule Uplink.Metrics.Producer do
  # Redacted for brevity...
  @impl true
  def handle_demand(demand, state) when demand <= 0 do
    {:noreply, [], state}
  end

  def handle_demand(demand, state) do
    if ready_to_fetch?(state) do
      {messages, state} = load_metrics(demand, state)
      {:noreply, messages, state}
    else
      {:noreply, [], state}
    end
  end
  # ...
end
The ready_to_fetch? function will ensure that we don't ship more data than what was configured. It's a simple call that checks the last time we fetched, and if the time is < than the configured interval we skip.
defmodule Uplink.Metrics.Producer do
  # ...
  defp ready_to_fetch?(state) do
    Cache.transaction(
      [keys: [{:monitors, :metrics, :last_fetched_timestamp}]],
      fn ->
        now = DateTime.to_unix(DateTime.utc_now(), :millisecond)

        last_fetched_timestamp = Cache.get({:monitors, :metrics, :last_fetched_timestamp})

        is_nil(last_fetched_timestamp) ||
          now - last_fetched_timestamp > state.poll_interval
      end
    )
  end
end
We use :nebulex caching library to store shared state across the cluster. Incase we run multiple nodes this code ensurs that there is a single source of truth for checking the last fetched time.
Next let's take a look at the load_metrics/2 call.
defmodule Uplink.Metrics.Producer do
  # ...
  defp load_metrics(demand, state) do
    demand = demand + state.demand

    metrics = Metrics.for_instances()

    previous_cpu_metrics = state.previous_cpu_metrics
    previous_network_metrics = state.previous_network_metrics
    cpu_60_metrics = state.cpu_60_metrics
    cpu_300_metrics = state.cpu_300_metrics
    cpu_900_metrics = state.cpu_900_metrics

    messages =
      transform_metrics(metrics, %{
        previous_cpu_metrics: previous_cpu_metrics,
        previous_network_metrics: previous_network_metrics,
        cpu_60_metrics: cpu_60_metrics,
        cpu_300_metrics: cpu_300_metrics,
        cpu_900_metrics: cpu_900_metrics,
        cycle: state.cycle
      })

    current_demand = demand - length(messages)

    fetch_timestamp = DateTime.to_unix(DateTime.utc_now(), :millisecond)

    Cache.put({:monitors, :metrics, :last_fetched_timestamp}, fetch_timestamp)

    previous_cpu_metrics =
      Enum.map(metrics, fn instance ->
        %{
          name: instance.data.name,
          project: instance.data.project,
          timestamp: fetch_timestamp,
          data: Map.get(instance.data.state, "cpu")
        }
      end)

    previous_network_metrics =
      Enum.map(metrics, fn instance ->
        %{
          name: instance.data.name,
          project: instance.data.project,
          timestamp: fetch_timestamp,
          data: Map.get(instance.data.state, "network")
        }
      end)

    state =
      state
      |> Map.put(:demand, current_demand)
      |> Map.put(:last_fetched_timestamp, fetch_timestamp)
      |> Map.put(:previous_cpu_metrics, previous_cpu_metrics)
      |> Map.put(:previous_network_metrics, previous_network_metrics)
      |> Map.put(:cycle, state.cycle + 1)

    state =
      if rem(state.cycle, 4) == 0 do
        Map.put(state, :cpu_60_metrics, previous_cpu_metrics)
      else
        state
      end

    state =
      if rem(state.cycle, 20) == 0 do
        Map.put(state, :cpu_300_metrics, previous_cpu_metrics)
      else
        state
      end

    state =
      if rem(state.cycle, 60) == 0 do
        Map.put(state, :cpu_900_metrics, previous_cpu_metrics)
      else
        state
      end

    {messages, state}
  end
  # ...
end
In essence this is where all the magic of data collection happens. We call the Metrics.for_instances() function. This call wraps all the calls to LXD and returns a list of instances with all the metrics attached. You'll notice that we need to collect and store the previous metrics as well this is because for CPU and Networking traffic we need to compute the difference across time. For the CPU metrics all we get is a single number. That number is the number of CPU usage time in nanoseconds.
Computing Usage
We can use the difference between the two usage to compute the CPU usage.
defp cpu_percentage(cores, time_diff_seconds, earlier_usage, later_usage) do
  available_compute = cores * time_diff_seconds * :math.pow(10, 9)

  (later_usage - earlier_usage) / available_compute
end
Updating the cpu metrics
You'll notice that we conditionally update the cpu_x_metrics based on which cycle we're in. The reason for the numbers 4, 20 and 60 is that we want to replace those metrics only if that many cycle has passed. In our code we are polling for metrics every 15 seconds. So to be able to compute the difference for load 1 which is the system load for 1 minute we replace the value on every 4th cycle. This gives us the ability to compute the difference on a 1 minute interval. Same goes for 20 and 60, if each of our interval is 15 seconds 15 * 20 = 300 secs = 5 mins. You get the idea.
Once we've transformed the message we return the tuple {messages, state} back to the caller.
Transforming the Metrics
In the code above you'll notice there is a call to transform_metrics/2. Let's take a look at that function and see what's inside.
defmodule Uplink.Metrics.Producer do
  # ...
  defp transform_metrics(metrics, %{
          previous_cpu_metrics: previous_cpu_metrics,
          previous_network_metrics: previous_network_metrics,
          cpu_60_metrics: cpu_60_metrics,
          cpu_300_metrics: cpu_300_metrics,
          cpu_900_metrics: cpu_900_metrics,
          cycle: cycle
        }) do
    metrics
    |> Enum.map(fn metric ->
      previous_cpu_metric =
        Enum.find(
          previous_cpu_metrics,
          &find_matching_previous(&1, metric.data.name, metric.data.project)
        )

      previous_network_metric =
        Enum.find(
          previous_network_metrics,
          &find_matching_previous(&1, metric.data.name, metric.data.project)
        )

      cpu_60_metric =
        Enum.find(
          cpu_60_metrics,
          &find_matching_previous(&1, metric.data.name, metric.data.project)
        )

      cpu_300_metric =
        Enum.find(
          cpu_300_metrics,
          &find_matching_previous(&1, metric.data.name, metric.data.project)
        )

      cpu_900_metric =
        Enum.find(
          cpu_900_metrics,
          &find_matching_previous(&1, metric.data.name, metric.data.project)
        )

      %{
        metric: metric,
        cycle: cycle,
        previous_network_metric: previous_network_metric,
        previous_cpu_metric: previous_cpu_metric,
        cpu_60_metric: cpu_60_metric,
        cpu_300_metric: cpu_300_metric,
        cpu_900_metric: cpu_900_metric
      }
    end)
    |> Enum.map(&transform_message/1)
  end
end
All this function is doing is taking the metrics and matching them up to the individual instance metrics. By matching on the name and project of the instance. In LXD you can isolate your instances by project, this is like namespacing in kubernetes. We then call the transform_message/1 which basically outputs %Broadway.Message{} which is what broadway expects.
defmodule Uplink.Metrics.Producer do
  # ...
  defp transform_message(message) do
    %Broadway.Message{
      data: message,
      acknowledger: Broadway.NoopAcknowledger.init()
    }
  end
end
For our case we pass the Broadway.NoopAcknowledger.init() as the acknowledger because there is nothing to acknowledge. To see the full example you can head over to the github repository.
Implementing the Broadway Pipeline
Now that we've done the hardwork of collecting and transforming the data, next we need to ship it using the pipeline. The pipleine is a lot simpler let's take a look at the module.
defmodule Uplink.Metrics.Pipeline do
  use Broadway

  alias Broadway.Message

  # Redacted for brevity ..
  def handle_message(_, %Message{data: data} = message, _) do
    %{
      metric: instance_metric,
      previous_cpu_metric: previous_cpu_metric,
      previous_network_metric: previous_network_metric,
      cpu_60_metric: cpu_60_metric,
      cpu_300_metric: cpu_300_metric,
      cpu_900_metric: cpu_900_metric
    } = data

    memory = Document.memory(instance_metric)
    cpu = Document.cpu(instance_metric, previous_cpu_metric)
    uptime = Document.uptime(instance_metric)
    filesystem = Document.filesystem(instance_metric)
    diskio = Document.diskio(instance_metric)
    network = Document.network(instance_metric, previous_network_metric)

    load =
      Document.load(instance_metric, %{
        cpu_60_metric: cpu_60_metric,
        cpu_300_metric: cpu_300_metric,
        cpu_900_metric: cpu_900_metric
      })

    data = %{
      memory: memory,
      cpu: cpu,
      uptime: uptime,
      filesystem: filesystem,
      diskio: diskio,
      network: network,
      load: load
    }

    Message.put_data(message, data)
  end

  # ...
end
The goal of this module is to generate documents that are in the format expected by Elasticsearch and simply send the data using the bulk api available in Elasticsearch.
The main workload in the pipeline is it passes the message from the Producer into the Document module and generates the document for :memory, :cpu, :uptime, :filesystem, :diskio, :network, and :load. The next part is the handle_batch which is where we actually ship data to elastic.
defmodule Uplink.Metrics.Pipeline do
  # ...
  def handle_batch(_, messages, _batch_info, context) do
    documents = to_ndjson(messages)
    monitors = Pipelines.get_monitors(context)

    Logger.info("[Metrics.Pipeline] pushing #{DateTime.utc_now()}")

    monitors
    |> Enum.map(fn monitor ->
      Metrics.push!(monitor, documents)
    end)

    messages
  end

  defp to_ndjson(messages) do
    documents =
      Enum.flat_map(messages, &to_entry/1)
      |> Enum.map(&Jason.encode!/1)
      |> Enum.join("\n")

    documents <> "\n"
  end

  defp to_entry(%Message{} = message) do
    dataset =
      message.data
      |> Enum.to_list()
      |> Enum.reject(fn {_key, value} ->
        is_nil(value)
      end)

    dataset
    |> Enum.flat_map(&build_request/1)
  end

  defp build_request({type, data}) when is_list(data) do
    index = Metrics.index(type)

    Enum.reduce(data, [], fn entry, acc ->
      metadata = %{"create" => %{"_index" => index}}

      [metadata, entry | acc]
    end)
  end

  defp build_request({type, data}) when is_map(data) do
    index = Metrics.index(type)
    metadata = %{"create" => %{"_index" => index}}

    [metadata, data]
  end
end
All we're doing here is generating the ndjson format which is essentially json encoded records delimited by \n. You'll notice that there is a monitors = Pipeline.get_monitors(context) call. This retrieves the monitors from instellar the core module that stores the credentials for pushing data to elastic. We will write another blog post on that in the near future.
That's essentially it. There is also another part not covered here which is generating the document in the format expected by elasticsearch. Feel free to checkout the source code to see how everything fits together.
Closing thoughts
Overall we found that doing things this way was really beneficial since it means we don't need to install anything on our customer's cluster. We collect, transform and ship data to an endpoint without having to worry about backpressure and handling all the details of a data shipper.
LXD vs K8s
While in this example we extracted data from an LXD cluster, nothing stops us from doing the same with a kubernetes cluster. Kubernetes has the cadvisor api which also gives you alot of these metrics.
Next we can just query and use this data for lots of things for example alerts, anomaly detection, usage prediction and recommendation systems.
If you'd like to try this out you can sign up create a cluster and login to your own uplink instance to run some of these commands.